机械通气(mechanical ventilation,MV)作为一种生命支持手段,在重症监护病房(intensive care unit,ICU)患者的救治中起着至关重要的作用。长期的MV会导致治疗费用的增加和不良的临床结果[1-2]。因此,患者呼吸衰竭的病因得到改善,就应考虑停用MV。在临床工作中,有一些流程可供拔除气管插管、停用MV使用,但是拔管后呼吸衰竭和再次插管是ICU机械通气脱机过程中经常出现的并发症[3-5]。在ICU中,大约15%的患者会发生再次插管,并且与预后较差有关,因此预防再插管引起了临床医生的强密切关注[6-7]。然而,对于拔管后的患者,MV的监测指标不再可用,所以拔管后早期发现呼吸功能恶化并不简单。对拔管后的患者的呼吸功能进行连续无创监测具有重要的临床价值。肺电阻抗断层成像(electrical impedance tomography,EIT)是一种连续的、无创的、不依赖于操作者的成像技术, 可根据胸腔内阻抗随时间的变化,即时监测整体肺容量和通气区域分布的变化。EIT可确定呼气末肺阻抗的变化,评估潮气量的总体和区域分布,并获得通气空间分布指数[8]。拔管失败是临床医生面临棘手的临床问题,其潜在机制尚未完全阐明[9]。本研究认为EIT可以通过提供额外的见解来帮助理解拔管失败患者的病理生理。因此,本研究针对拔管失败患者设计了这项观察性研究,旨在评估EIT对重症患者拔管失败的预测价值。
1 资料与方法 1.1 研究对象本研究为前瞻性队列研究,纳入2022年1月至2024年1月于安徽医科大学第一附属医院急诊ICU收治的行有创MV并进行自主呼吸试验(spontaneous breathing trial,SBT)的重症患者。根据患者拔管后48 h内是否重新插管,分为拔管成功组和拔管失败组[10]。所有患者或其家属签署知情同意书,并通过安徽医科大学第一附属医院伦理委员会批准(审批号:PJ2024-04-69)。
纳入标准:(1)年龄>18岁;(2)经口气管插管进行了至少48 h的MV;(3)至少具备一种拔管失败的危险因素:年龄 > 65岁、慢性心脏病、慢性肺部疾病;(4)成功通过了SBT。排除标准:(1)妊娠;(2)EIT禁忌证(胸腔引流管、心脏起搏器或植入式除颤器、颈椎植入物);(3)使用体外膜氧合器(extracorporeal membrane oxygenation, ECMO)。
1.2 研究资料收集患者的年龄、性别、体质指数、急性生理与慢性健康评分(acute physiology and chronic health evaluation, APACHEⅡ)、MV的天数、MV的主要病因、拔管失败的危险因素、拔管前后患者[即拔管前(T0)、拔管后2 h (T2) 和拔管后6 h (T6)]的基本生命体征、相关实验室指标及EIT测量值。
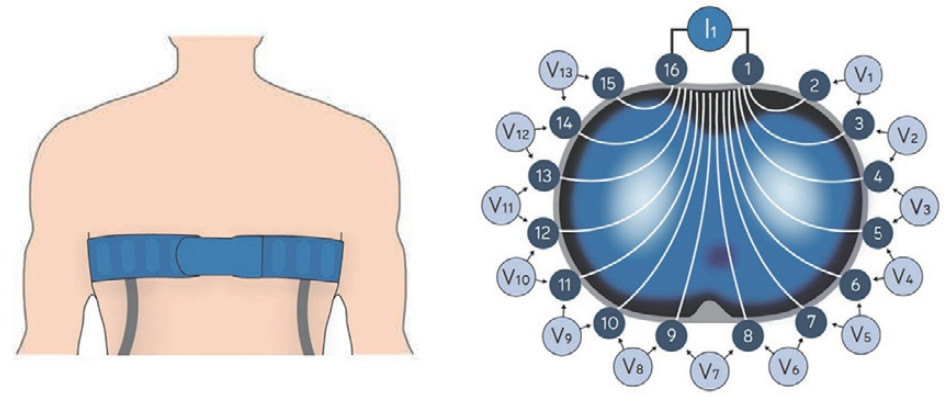
1.3 EIT测量使用Infvision ET1000(北京华睿博视医学影像技术有限公司)进行EIT测量。在测量过程中,将带有16个表面电极的硅胶EIT胸带放置在患者胸部第五或第六肋骨之间,该胸带与EIT监测器相连,用于收集相关参数,见图 1。根据EIT记录的参数,计算出了EIT衍生指数:全肺非均质(global inhomogeneity index,GI) 指数、通气中心(the center of ventilation,COV)、通气延迟区域(the regional ventilation delay,RVD)、可用通气面积(surface available for ventilation,SAV) [11-13]。

|
| 图 1 EIT监测器 Fig 1 The electrical impedance tomography |
|
|
所有数据采用SPSS 23.0统计学软件进行分析处理。符合正态分布的连续变量采用均数±标准差(x ± s)表示,组间比较采用成组t检验。非正态分布的连续变量采用中位数及四分位数间距[M(Q1,Q3)]表示,组间比较采用秩和检验。分类变量则通过例(百分率)表示,组间比较使用χ2检验或Fisher确切概率法。通过描述受试者操作特性曲线(receiver operating characteristic, ROC)进一步得出各观察指标临界值及评价效能,同时将差异有统计学意义的变量作为自变量进入以拔管失败为因变量的回归分析。以P<0.05为差异有统计学意义。
2 结果 2.1 两组患者一般资料分析收集符合纳入排除标准的重症患者110例[拔管成功组58例、拔管失败组52例],其中男性33例,女性77例。两组患者之间年龄、性别、体质指数、插管的主要病因、拔管前带有创呼吸机的天数及拔管失败危险因素差异无统计学意义(P>0.05),见表 1。
| 变量 | 拔管成功组 (n=58) |
拔管失败组 (n=52) |
统计值 | P值 |
| 年龄(岁)a | 57 (51,68) | 59(51,68) | -0.637 | 0.524 |
| 男性(%)b | 17(29.3) | 16(30.8) | 0.028 | 0.868 |
| 体质指数(kg/m2)a | 26(22,28) | 26(23,29) | -0.839 | 0.401 |
| 插管的主要病因(%)b | ||||
| 脓毒症 | 42 (72.4) | 44 (84.6) | 2.393 | 0.122 |
| 心肺复苏 | 2 (3.4) | 0 (0) | 1.826 | 0.177 |
| 昏迷 | 10 (17.2) | 4 (7.7) | 2.251 | 0.134 |
| 休克 | 2 (3.4) | 4 (7.7) | 0.958 | 0.328 |
| 其他 | 2(3.4) | 0 (0) | 1.826 | 0.177 |
| 拔管前带有创呼吸机时间(d)a | 10(8,11) | 10(9, 11) | -0.652 | 0.515 |
| 拔管失败危险因素(%)b | ||||
| 年龄>65岁 | 17 (29.3) | 16 (30.8) | 0.028 | 0.868 |
| 慢性心脏系统疾病 | 24 (41.4) | 16 (30.8) | 1.334 | 0.248 |
| 慢性呼吸系统疾病 | 18 (31.0) | 20 (38.5) | 0.669 | 0.413 |
| 注:a为M(Q1,Q3);b为(n,%) | ||||
拔管前患者的APACHEⅡ评分、收缩压、心率、呼吸频率、pH、氧合指数(PaO2/FiO2)、PaCO2、血细胞比容、左心室射血分数在两组间差异无统计学意义,见表 2。
| 变量 | 拔管成功组 | 拔管失败组 | 统计值 | P值 |
| APACHEⅡ评分a | 18(15, 22) | 18(15, 24) | -0.204 | 0.838 |
| 收缩压(mmHg)a | 129(126, 135) | 131(128, 137) | -1.512 | 0.130 |
| 心率(次/min)a | 98(93, 104) | 99(96, 104) | -1.007 | 0.314 |
| 呼吸频率(次/min)a | 22(21, 26) | 23(22, 25) | -1.948 | 0.051 |
| pHa | 7.45(7.41, 7.47) | 7.45(7.44, 7.48) | -1.409 | 0.159 |
| PaO2/FiO2(mmHg)a | 250(225, 255) | 250(225, 250) | -1.685 | 0.092 |
| PaCO2(mmHg)a | 41(39, 42) | 39 (37, 45) | -1.114 | 0.265 |
| 血细胞比容(%)a | 27(27, 28) | 28(27,30) | -1.914 | 0.056 |
| 左心室射血分数(%)a | 50(45, 50) | 50(49, 50) | -1.598 | 0.110 |
| 注:a为M(Q1,Q3);APACHEⅡ评分为急性生理与慢性健康评分 | ||||
拔管失败组的患者比拔管成功组的患者在拔管前、拔管后具有更小的SAV,而且GI指数较高。两组间RVD和COV差异无统计学意义,见表 3。
| 变量 | 拔管成功组 | 拔管失败组 | 统计值 | P值 |
| GI指数(T0)a | 0.37(0.37, 0.38) | 0.42(0.41, 0.42) | -6.262 | <0.001 |
| GI指数(T2)a | 0.38(0.38, 0.39) | 0.41(0.40, 0.41) | -6.635 | <0.001 |
| GI指数(T6)a | 0.38(0.37, 0.39) | 0.39(0.39, 0.40) | -4.802 | <0.001 |
| RVD(T0)(%)a | 7.7 (7.7, 9.225) | 9.1(8.5, 9.1) | -1.799 | 0.072 |
| RVD(T2)(%)a | 9.0(8.0, 9.3) | 9.3(8.3,9.3) | -1.843 | 0.065 |
| RVD(T6)(%)a | 7.9(7.9, 9.2) | 9.2(7.9, 9.2) | -1.787 | 0.074 |
| SAV(T0)(像素)a | 406 (390, 406) | 352(352,373) | -6.116 | <0.001 |
| SAV(T2)(像素)a | 399(387, 399) | 344(344,368) | -6.596 | <0.001 |
| SAV(T6)(像素)a | 398(382.5, 398) | 315(315,330) | -6.284 | <0.001 |
| COV(T0)(%)a | 50 (49, 50) | 50(50, 50) | -0.234 | 0.815 |
| COV(T2)(%)a | 50(49, 51) | 49(49, 51) | -1.602 | 0.109 |
| COV(T6)(%)a | 49(49, 50) | 50(49, 50) | -1.933 | 0.053 |
| 注:a为M(Q1,Q3);GI指数为全肺非均质指数;COV为通气中心;RVD为通气延迟区域;SAV为可用通气面积 | ||||
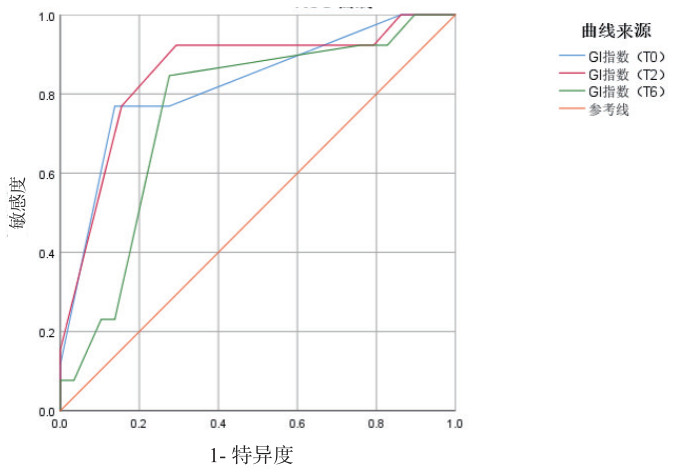
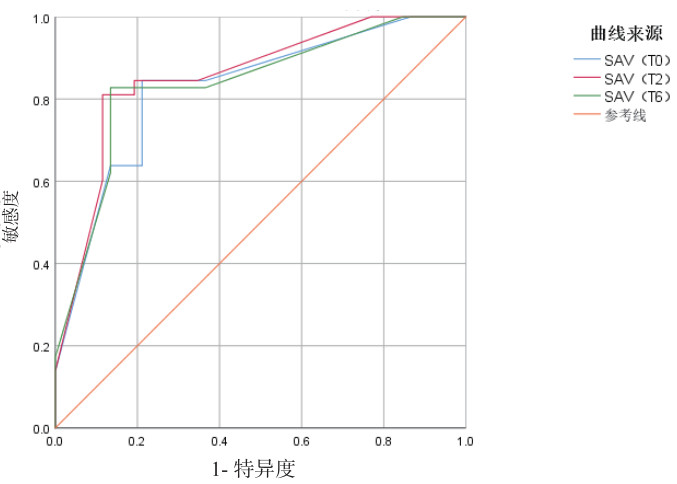
在研究指标中,T2的GI指数和T2的SAV的预测效果最佳, ROC曲线下面积分别为0.854和0.856,敏感度分别为92.3%和81.1%,特异度分别为70.7%和88.5%,见图 2,图 3和表 4。T2的GI指数和T2的SAV与拔管失败的相关性高于其他的时间点,见表 5。

|
| 图 2 不同时间点GI指数对拔管失败预测效能的ROC曲线图 Fig 2 ROC curve of GI index at different time points for predicting tubing failure |
|
|

|
| 图 3 不同时间点SAV对拔管失败预测效能的ROC曲线图 Fig 3 ROC curve of SAV at different time points for predicting tubing failure |
|
|
| 变量 | 最佳临界值 | AUC | P值 | 95%CI | 敏感度(%) | 特异度(%) |
| T0 | ||||||
| GI指数 | 0.41 | 0.824 | <0.001 | 0.744~0.903 | 76.9 | 86.2 |
| SAV | 377.5 | 0.827 | <0.001 | 0.749~0.905 | 84.5 | 78.8 |
| T2 | ||||||
| GI指数 | 0.385 | 0.854 | <0.001 | 0.779~0.929 | 92.3 | 70.7 |
| SAV | 382.5 | 0.856 | <0.001 | 0.784~0.928 | 81.1 | 88.5 |
| T6 | ||||||
| GI指数 | 0.385 | 0.756 | <0.001 | 0.661~0.851 | 84.6 | 72.4 |
| SAV | 375.5 | 0.838 | <0.001 | 0.761~0.914 | 82.8 | 86.5 |
| 注:GI指数为全肺非均质指数;SAV为可用通气面积 | ||||||
| 指标 | GI指数 (T0) |
GI指数 (T2) |
GI指数 (T6) |
SAV (T0) |
SAV (T2) |
SAV (T6) |
| r值 | 0.600 | 0.636 | 0.460 | -0.586 | -0.632 | -0.602 |
| P值 | <0.001 | <0.001 | <0.001 | <0.001 | <0.001 | <0.001 |
| 注:GI指数为全肺非均质指数;SAV为可用通气面积 | ||||||
撤机是一个循序渐进的过程,在这个过程中,患者从机器支持到自主呼吸,包括三个关键步骤: 首先,当患者的临床情况允许时,逐渐减少机械通气支持的力度。其次,进行SBT以评估患者自主呼吸的能力。第三,患者完全脱离呼吸机[14]。任何一个步骤出现问题都会导致撤机失败。目前,临床上应用的呼吸机撤机评估系统主要包括疾病评分、患者生理指标和血气分析结果[15]。因此,该系统存在明显的缺陷,它严重依赖医生的主观判断,较少依赖肺通气状态的直接指标。
EIT可以让临床医生在床边实时观察患者的肺通气动态变化,近年来已有用于指导呼吸机撤机的研究[16]。本研究旨在通过EIT描述患者局部肺通气变化筛选出拔管失败的高危人群。本研究发现与拔管成功组比较,拔管失败组的患者有更小的SAV,而且GI指数较高。在所有拔管失败的患者中,呼吸系统是最主要的原因,因为呼吸机提供的呼吸功能监测在拔管后已不复存在,所以发现拔管患者的呼吸功能恶化具有挑战性 [17]。在之前的一项研究中发现在拔管后2 h内进行呼吸困难评估和呼吸肌超声检查可识别出拔管过程中可能失败的患者[18]。值得注意的是,因呼吸系统原因导致拔管失败的患者的特点是肺通气功能减弱[19]。因此,对拔管前后的肺通气情况进行评估具有潜在的临床意义,有助于识别高风险患者,并及时实施个性化的预防策略,如无创通气或高流量氧疗。在床边,临床医师可以通过EIT对患者的肺通气进行评估[20]。
本研究证实了之前的数据,即拔管失败患者在拔管前通过肺部超声检查发现肺通气功能丧失[7]。此外,在拔管失败的患者中,可用于通气的面积明显减少。然而,拔管成功与拔管失败之间的RVD和COV均差异无统计学意义。这可能是由于RVD和COV是通气分布异质性的定性描述,而SAV、GI则提供了通气面积的数量信息。在之前的一项研究中,Longhini等[21]还发现拔管成功和拔管失败患者在拔管前(压力支持通气下)的GI指数相似,拔管失败组在拔管后GI指数显著增加。本研究首次对EIT在拔管后的应用进行了探讨。笔者假设EIT可以在拔管后不久检测到肺通气的变化,但它也可能在更长的时间内有用。事实上,笔者观察到,拔管后与对照组相比,拔管失败的患者在T2时的GI指数显著更高,在T2时的SAV也明显更低。在拔管失败的情况下,失败组拔管后GI指数和SAV的变化可能的解释。SAV是肺内区域复张的一个描述指标,而GI指数则量化了通气分布,GI指数越高,不均匀性越高。因此,本研究表明拔管失败与通气分布不均匀有关。Bickenbach等[22]提出,自主呼吸试验结束时GI指数的增加可能与潮气量减少或肺顺应性降低有关。这种特殊的模式也可以用呼吸肌无力来解释,特别是在脱机时隔肌功能障碍的情况下[19]。
本研究存在一定的局限性:(1)这是一项探索性研究,样本量有限,但研究结果可为后续大规模确证性研究提供参考;(2)由于技术和设备问题(信号伪影、患者运动或咳嗽、肥胖、患者拒绝),无法收集所有计划的EIT记录;(3)研究时间不够长,无法评估其他相关临床结果。
利益冲突 所有作者声明无利益冲突。
作者贡献声明 笪伟,牛明玥:实验操作、论文撰写;朱甜甜,王晓波,谢晓东,李冉,陈蕊,梁培培:数据收集及整理、统计学分析;丁振兴、张泓:研究设计、论文修改
| [1] | Schönhofer B, Geiseler J, Dellweg D, et al. Prolonged weaning: S2k guideline published by the German respiratory society[J]. Respiration, 2020: 1-102. DOI:10.1159/000510085 |
| [2] | He Q, Wang W, Zhu SC, et al. The epidemiology and clinical outcomes of ventilator-associated events among 20, 769 mechanically ventilated patients at intensive care units: an observational study[J]. Crit Care, 2021, 25(1): 44. DOI:10.1186/s13054-021-03484-x |
| [3] | Sato R, Hasegawa D, Hamahata NT, et al. The predictive value of airway occlusion pressure at 100 msec (P0.1) on successful weaning from mechanical ventilation: a systematic review and meta-analysis[J]. J Crit Care, 2021, 63: 124-132. DOI:10.1016/j.jcrc.2020.09.030 |
| [4] | da Silva Neto AE, de Souza LC, Costa HL, et al. The timed inspiratory effort index as a weaning predictor: analysis of intra- and interobserver reproducibility[J]. Respir Care, 2020, 65(5): 636-642. DOI:10.4187/respcare.07225 |
| [5] | Thille AW, Richard JC, Brochard L. The decision to extubate in the intensive care unit[J]. Am J Respir Crit Care Med, 2013, 187(12): 1294-1302. DOI:10.1164/rccm.201208-1523CI |
| [6] | Epstein SK, Ciubotaru RL, Wong JB. Effect of failed extubation on the outcome of mechanical ventilation[J]. Chest, 1997, 112(1): 186-192. DOI:10.1378/chest.112.1.186 |
| [7] | Béduneau G, Pham T, Schortgen F, et al. Epidemiology of weaning outcome according to a new definition. the WIND study[J]. Am J Respir Crit Care Med, 2017, 195(6): 772-783. DOI:10.1164/rccm.201602-0320OC |
| [8] | Lobo B, Hermosa C, Abella A, et al. Electrical impedance tomography[J]. Ann Transl Med, 2018, 6(2): 26. DOI:10.21037/atm.2017.12.06 |
| [9] | Boles JM, Bion J, Connors A, et al. Weaning from mechanical ventilation[J]. Eur Respir J, 2007, 29(5): 1033-1056. DOI:10.1183/09031936.00010206 |
| [10] | Torrini F, Gendreau S, Morel J, et al. Prediction of extubation outcome in critically ill patients: a systematic review and meta-analysis[J]. Crit Care, 2021, 25(1): 391. DOI:10.1186/s13054-021-03802-3 |
| [11] | Bachmann MC, Morais C, Bugedo G, et al. Electrical impedance tomography in acute respiratory distress syndrome[J]. Crit Care, 2018, 22(1): 263. DOI:10.1186/s13054-018-2195-6 |
| [12] | Zhao ZQ, Pulletz S, Frerichs I, et al. The EIT-based global inhomogeneity index is highly correlated with regional lung opening in patients with acute respiratory distress syndrome[J]. BMC Res Notes, 2014, 7: 82. DOI:10.1186/1756-0500-7-82 |
| [13] | Muders T, Luepschen H, Zinserling J, et al. Tidal recruitment assessed by electrical impedance tomography and computed tomography in a porcine model of lung injury[J]. Crit Care Med, 2012, 40(3): 903-911. DOI:10.1097/CCM.0b013e318236f452 |
| [14] | Vetrugno L, Guadagnin GM, Brussa A, et al. Mechanical ventilation weaning issues can be counted on the fingers of just one hand: part 1[J]. Ultrasound J, 2020, 12(1): 9. DOI:10.1186/s13089-020-00161-y |
| [15] | Baptistella AR, Sarmento FJ, da Silva KR, et al. Predictive factors of weaning from mechanical ventilation and extubation outcome: a systematic review[J]. J Crit Care, 2018, 48: 56-62. DOI:10.1016/j.jcrc.2018.08.023 |
| [16] | Bickenbach J, Czaplik M, Polier M, et al. Electrical impedance tomography for predicting failure of spontaneous breathing trials in patients with prolonged weaning[J]. Crit Care, 2017, 21(1): 177. DOI:10.1186/s13054-017-1758-2 |
| [17] | Jaber S, Quintard H, Cinotti R, et al. Risk factors and outcomes for airway failure versus non-airway failure in the intensive care unit: a multicenter observational study of 1514 extubation procedures[J]. Crit Care, 2018, 22(1): 236. DOI:10.1186/s13054-018-2150-6 |
| [18] | Dres M, Similowski T, Goligher EC, et al. Dyspnoea and respiratory muscle ultrasound to predict extubation failure[J]. Eur Respir J, 2021, 58(5): 2100002. DOI:10.1183/13993003.00002-2021 |
| [19] | Dres M, Rozenberg E, Morawiec E, et al. Diaphragm dysfunction, lung aeration loss and weaning-induced pulmonary oedema in difficult-to-wean patients[J]. Ann Intensive Care, 2021, 11(1): 99. DOI:10.1186/s13613-021-00886-6 |
| [20] | Longhini F, Maugeri J, Andreoni C, et al. Electrical impedance tomography during spontaneous breathing trials and after extubation in critically ill patients at high risk for extubation failure: a multicenter observational study[J]. Ann Intensive Care, 2019, 9(1): 88. DOI:10.1186/s13613-019-0565-0 |
| [21] | Longhini F, Maugeri J, Andreoni C, et al. Electrical impedance tomography during spontaneous breathing trials and after extubation in critically ill patients at high risk for extubation failure: a multicenter observational study[J]. Ann Intensive Care, 2019, 9(1): 88. DOI:10.1186/s13613-019-0565-0 |
| [22] | Bickenbach J, Czaplik M, Polier M, et al. Electrical impedance tomography for predicting failure of spontaneous breathing trials in patients with prolonged weaning[J]. Crit Care, 2017, 21(1): 177. DOI:10.1186/s13054-017-1758-2 |
 2024, Vol. 33


